I'm working on a system which purpose is monitoring employee productivity information.
Basically, an admin user can define targets for given timeframes (for instance, from 10:00h to 11:00h, team X is supposed to deliver N items) and we want to be able to see how should we be delivering in real time.
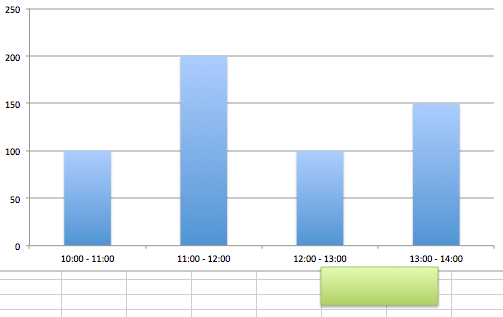
What I had in mind is something like the chart above, where the blue columns tell me the targets that have been set for every timeframe, and the green block shows me in which timeframe I currently am (let's say, for instance, that the width of the green block is equivalent to a 1-hour timeframe). And so this chart would exemplify a scenario where the current time is around 13:30h, and shows me what's the current target and the targets that had been set for the day
Does anyone know if there's any JS chart I could use to display this information?
Thanks a lot!

