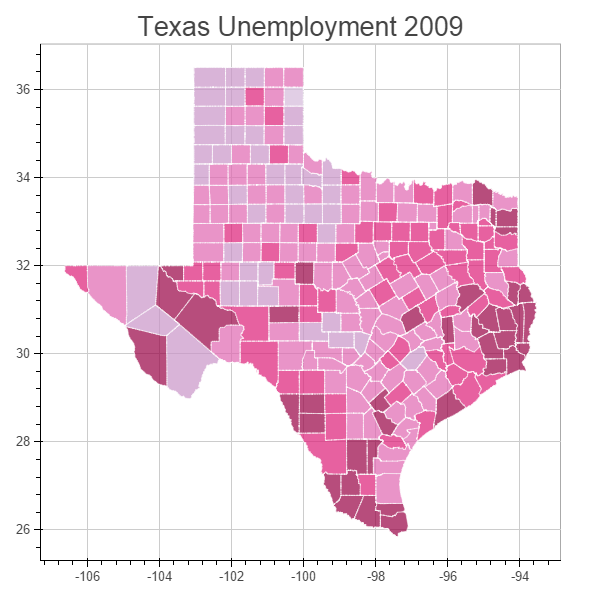
I have been creating choropleth maps in Python by adding patches and/or polygons in a matplotlib Axes but I'm looking for something easier to use.
Ideally, the interface should be similar to how contour maps or pseudocolor plots are created where, at the minimum, only one call to a function is needed to create these plots from data. Colors are automatically assigned and normalized based on values. A colorbar can then be added by calling another function.
So far, the closest package seems to be geopandas. Is there an another package that is nearer to what I want? That is, is there a package that can make a (basic) chloropleth of values stored as a dictionary, numpy array or pandas dataframe in one call? The final output is eventually a static image (for publication).
I'm willing to contribute code and help develop the chloropleth capability of a package since I currently end up creating my own function and manipulating Axes internals just to create a choropleth.
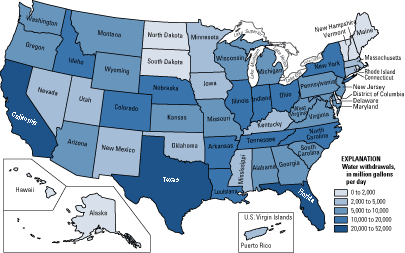
A choropleth map is something like this (example from Wikipedia) but the labels may be omitted:


