6

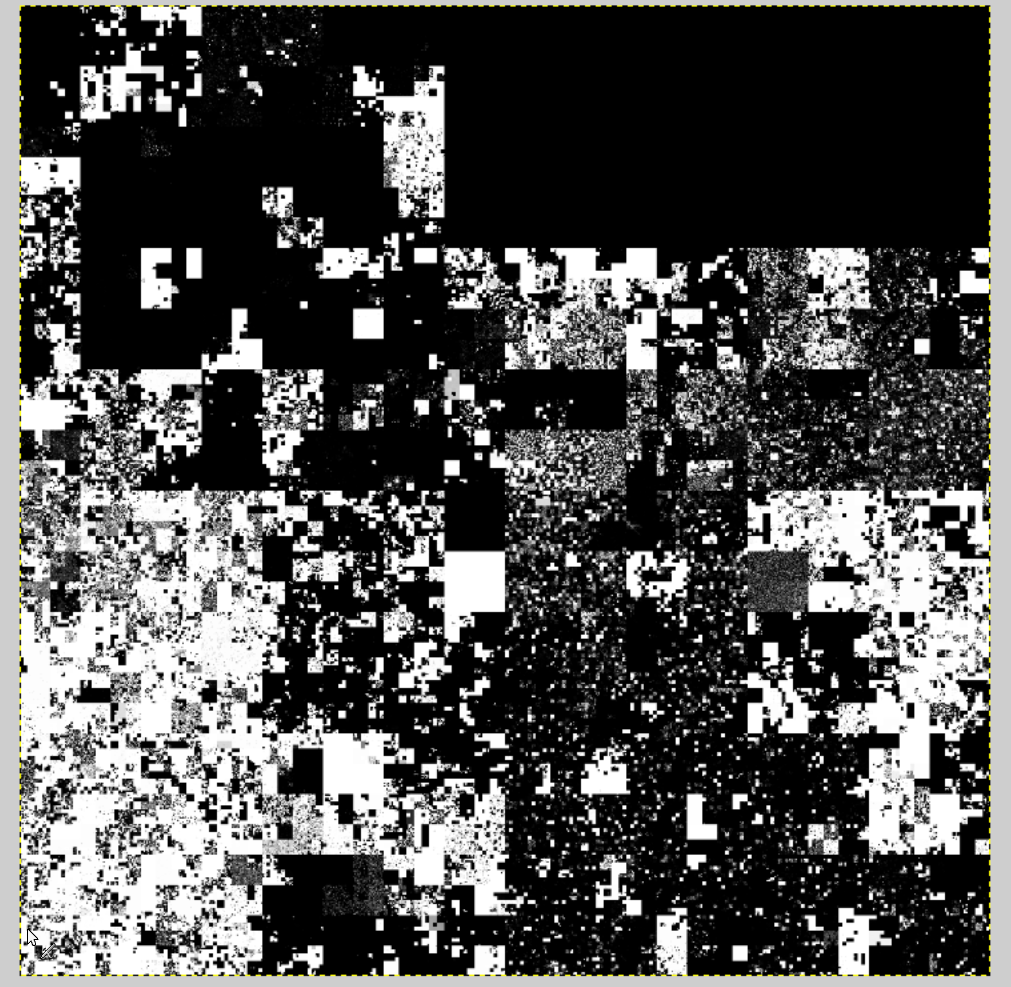
I generated a 65k x 65k (4 gigapixels) image that is basically a visualisation of the entire IPv4 address space from one perspective:

Hilbert curve of rDNS distribution in the entire Internet

No browser is willing to load an image that big, claiming it might be a gzip-bomb. This means I'm forced to split it into tiles at different zoom levels and add a front-end for interactive browsing of the map, just like in Google Maps (but for the IP addresses).

Is there a project that would let me do it quickly? Right now I'm thinking of experimenting with Leaflet's CRS-Simple, but that means I would have to figure out the alignment of the tiles, etc. to get a complete project. Is there an "all-in-one" solution that starts with a huge image and ends with a zoomable map? Bonus points if it supports Hilbert curves, or even better - IPv4 Hilbert curves, though just having an interactive map generator would be good.

3 Answers 3

2

You could use gdal2tiles to generate an image pyramid that leaflet or openlayers can use to display your image in a browser.

There is a fairly comprehensive tutorial or a github project that wraps the code for plain images like yours and generates the required html page.

2

Besides gdal2tiles, you could use vips. Details are in here: https://stackoverflow.com/a/51852934/10168903

If you want a GUI based solution, you could use Photoshop or Microsoft Image Composite Editor. You would need a plugin from zoomable.ca though.

0

You could use the Syncfusion Essential JS2 Maps component. This will load any image/tile from the server and render it as a map. Also, it provides many user interactive features.

Your Answer

By clicking “Post Your Answer”, you agree to our terms of service and acknowledge you have read our privacy policy.

Not the answer you're looking for? Browse other questions tagged or ask your own question.