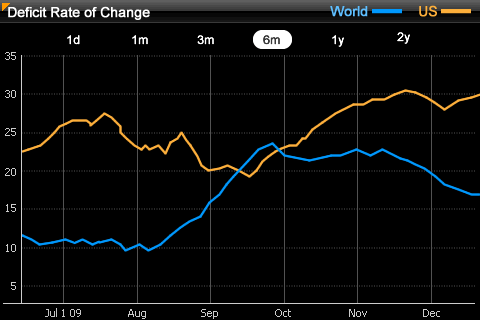
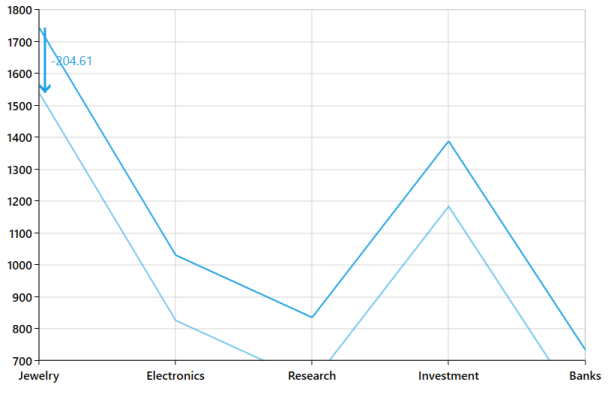
I am currently building an application using WPF in the .NET framework. The application will involve graphing data. Are there any good open-source graphing libraries or packages out there I can use for my application? When I say graph, I mean something that looks like:
-
What specific graph types (e.g. pie charts) do you need? Anything concerning the amount of data they must be capable to process? Output file types?– IzzyCommented Jul 29, 2016 at 15:29
-
Nah nothing like that yet, don't have a set of requirements in front of me yet. Just brainstorming for now.– SnoopCommented Jul 29, 2016 at 15:38
-
2Well, this is no brainstorming site :) To give recommendations, we need specific requirements. Please see What is required for a question to contain "enough information"? Without specific requirements, questions tend to get closed pretty soon as either "too broad" or "unclear what you're asking". You should have a rough idea on the amount of data already. So make this one specific for that amount, decide on "at least <chart types>", and decide on graphic formats (jpg/png or rather vector formats like svg). If needed, ask a new Q later.– IzzyCommented Jul 29, 2016 at 15:44
2 Answers
Disclosure, I work for SciChart
SciChart's WPF Chart is an option to consider
SciChart is mostly focussed on enterprise applications built in WPF and is designed to be a high performance option for applications that require big-data and complex interactions.
It's not free (commercial software), however a free version is available for educational use. Plans are in the works for free community versions for non-profits as well
Essential Chart for WPF is an option to consider.
The whole product is available for free through the community license if you qualify (less than 1 million USD in revenue), but not open source.
Note: I work for Syncfusion.


