2

I have a collection of python scripts that generate some interactive matplotlib graphics that illustrate an economics model. Here's an example:
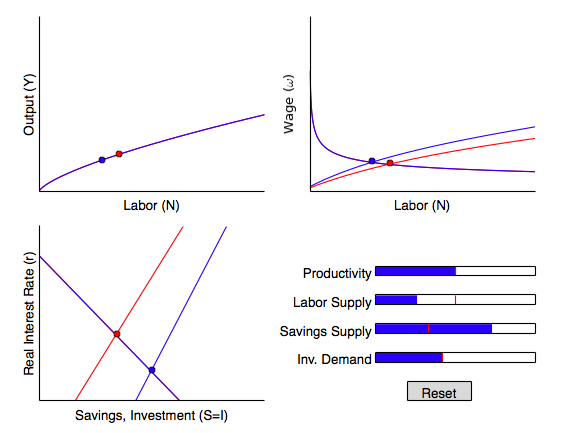
econ model graphs

I'm looking for a way to get these up so that they are web accessible. I've looked into creating an IPython notebook but I'm opposed to that idea because I'd rather not have people have to look through the code that generates them.

I have a basic knowledge of JavaScript and have considered rewriting them so that I could simply include them in a webpage, but I'd like to avoid that if possible.

Are there any tools to display a matplotlib frame in a webpage? Or is there some way that I haven't thought of to make this accessible via a webpage?

2
  • There are plenty of JS graphing libraries such as Chart.js and HighCharts
    – Huey
    Commented Jun 14, 2015 at 2:42
  • Do you just want static graphs, ot something people can interact with? What is your budget? What is your development stack? Please edit answers into your question.
    – user416
    Commented Jun 14, 2015 at 15:50

1 Answer 1

2

I suggest taking a look at the Plotly Python API - it should be easy to modify your code to give interactive graphs via that.

Your Answer

By clicking “Post Your Answer”, you agree to our terms of service and acknowledge you have read our privacy policy.

Not the answer you're looking for? Browse other questions tagged or ask your own question.