3

The Skinny

I am updating a VB6 application to .NET windows Forms and I am looking for a chart library that can do one of two things:

  • Display large amounts of data (1-2 million samples)
  • Display dynamically aggregated samples of the data (e.g. aggregation is a function of the x-axis display range; the less of the total x-axis that is visible, the more granular the data displayed is).

The Detail

This application takes data from a serial device and saves it to simple CSV or other format files. The data is not stored in a database so dynamic data functions that query the database are not going to work (I have seen these in web controls, but have generally disregarded any mention of database when looking for a winforms variant).

The customer occasionally will want to zoom in on the chart to view fine grain values. This can be done with the vanilla windows forms Chart control, but loading that much data in is time consuming (about 30 seconds on my dev machine) and the zooming feature is pretty slow to respond. I have tried looking into aggregation through the control but it looks like I would have to code my own aggregation system. I don't really have the time to do that. Does anyone know of a charting library that can create X/Y line charts with large amounts of data and stay fairly responsive?

3
  • So it’s just going to be a simple line chart? How many lines would there be? What have you already considered/test? There appear to be a number of options depending on your infrastructure (e.g., can you use JavaScript or embed an HTML control in the app?) These two SO questions are particularly germane. (In fact, this is probably an SO question more than a SR question.)
    – Synetech
    Commented Jul 24, 2014 at 21:14
  • Typically there will be three series, with the same number of points each (often > 1 million). I have tried charting libraries of some of the bigger control providers (ComponentOne, Infragistics, DevExpress, Telerik, etc) and they are all quite sluggish or experience OutOfMemoryExceptions when trying to display the data. Microsoft supplied a chart control that will display the data (at a million points it takes about 10-15 seconds to display. I am testing out SciCharts right now and it looks very promising. 1 million points in less than a second and it has zooming and panning features. Commented Jul 24, 2014 at 21:25
  • @Synetech I have had questions downvoted and closed before when looking for libraries (particularly when they are likely to be for-pay). Also, saw this board referenced fro SO on another users request. Commented Jul 25, 2014 at 4:37

6 Answers 6

1

SciCharts has been the answer. I was able to load millions of data points into a table with almost no detectable lag, and it zooms and pans smoothly. The app that I was putting it in is a Winforms app, so I have had to host the chart in a WPF window that is called and managed by Windows Forms. That aside, Sci charts has fit the bill.

3
  • SciChart is not a WinForms control. Commented Jun 15, 2020 at 7:23
  • 1
    @PasiTuomainen I failed to mention that I ended up porting the application to WPF. Commented Jun 17, 2020 at 18:19
  • OK, we develop WinForms charts, WPF charts, and UWP charts as separate APIs for a reason. Microsoft provides host controls, but all of them have their handicaps. Using a WinForms chart in WinForms, WPF chart in WPF, and UWP chart in UWP is the best option. Commented Jun 22, 2020 at 11:21
1

You can create your own graph control. The basic principle is use of slope point form. You can use my code for free: http://www.codeproject.com/Articles/14327/Drawing-medical-waveforms-using-a-Windows-Mobile

Few suggestions from my experience.

  1. Do not load all the data at once. Build a user experience of some sort, for example, a slider, to request the next set of data.

  2. Use Fast Fourier Transform (FFT) https://en.wikipedia.org/wiki/Fast_Fourier_transform as you have millions of values to process for which you want to find frequency of samples (Is that what you mean yb aggregation of samples?).

1

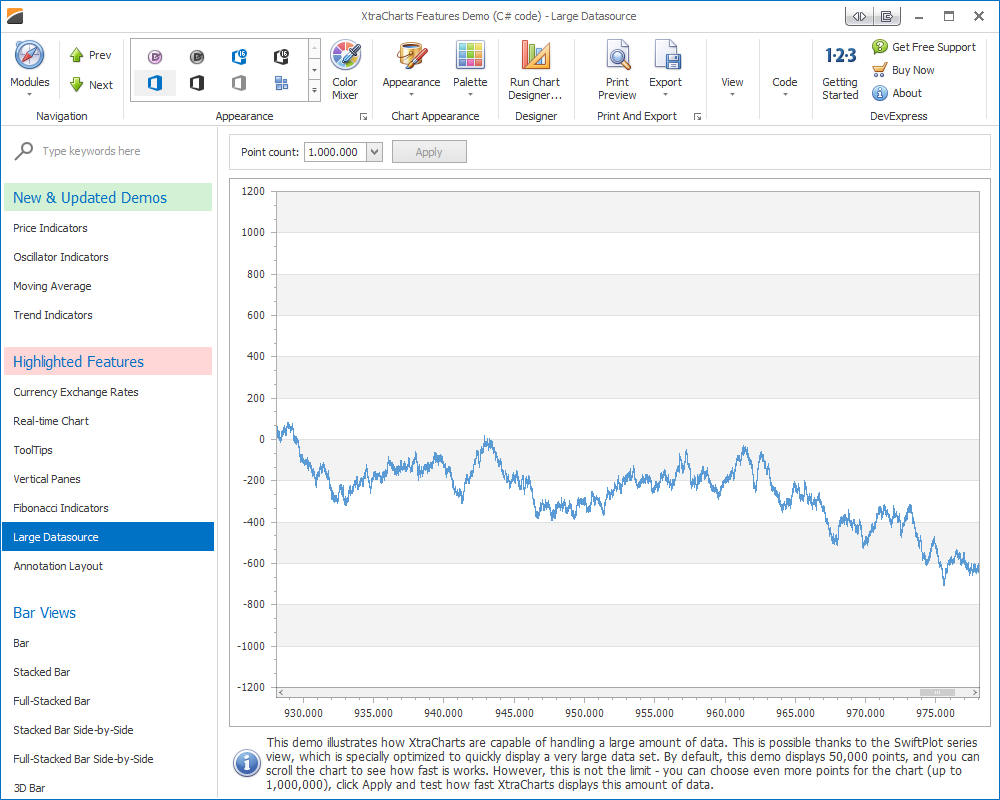
I have DevExpress XTraCharts. While I have personally not used so many data points yet, it comes with a "large datasource" demo application that uses 1.000.000 points to demonstrate how fast it is and it is fast on my old Intel i5 machine.

Large Dataset source

It is a commercial product, starting at 900$ and contains much more than you need. Unfortunately you can't buy smaller pieces like single controls.

It does not need a SQL data source, you can use plain .NET objects and needs minimal programming if the properties are public.

If you want to do a min/max aggregation, that's also supported:

Screenshot from demo application

1

MindFusion has a WinForms control, which has recently been redesigned and the performance is very good. It sells either as a single product or in a pack.

0

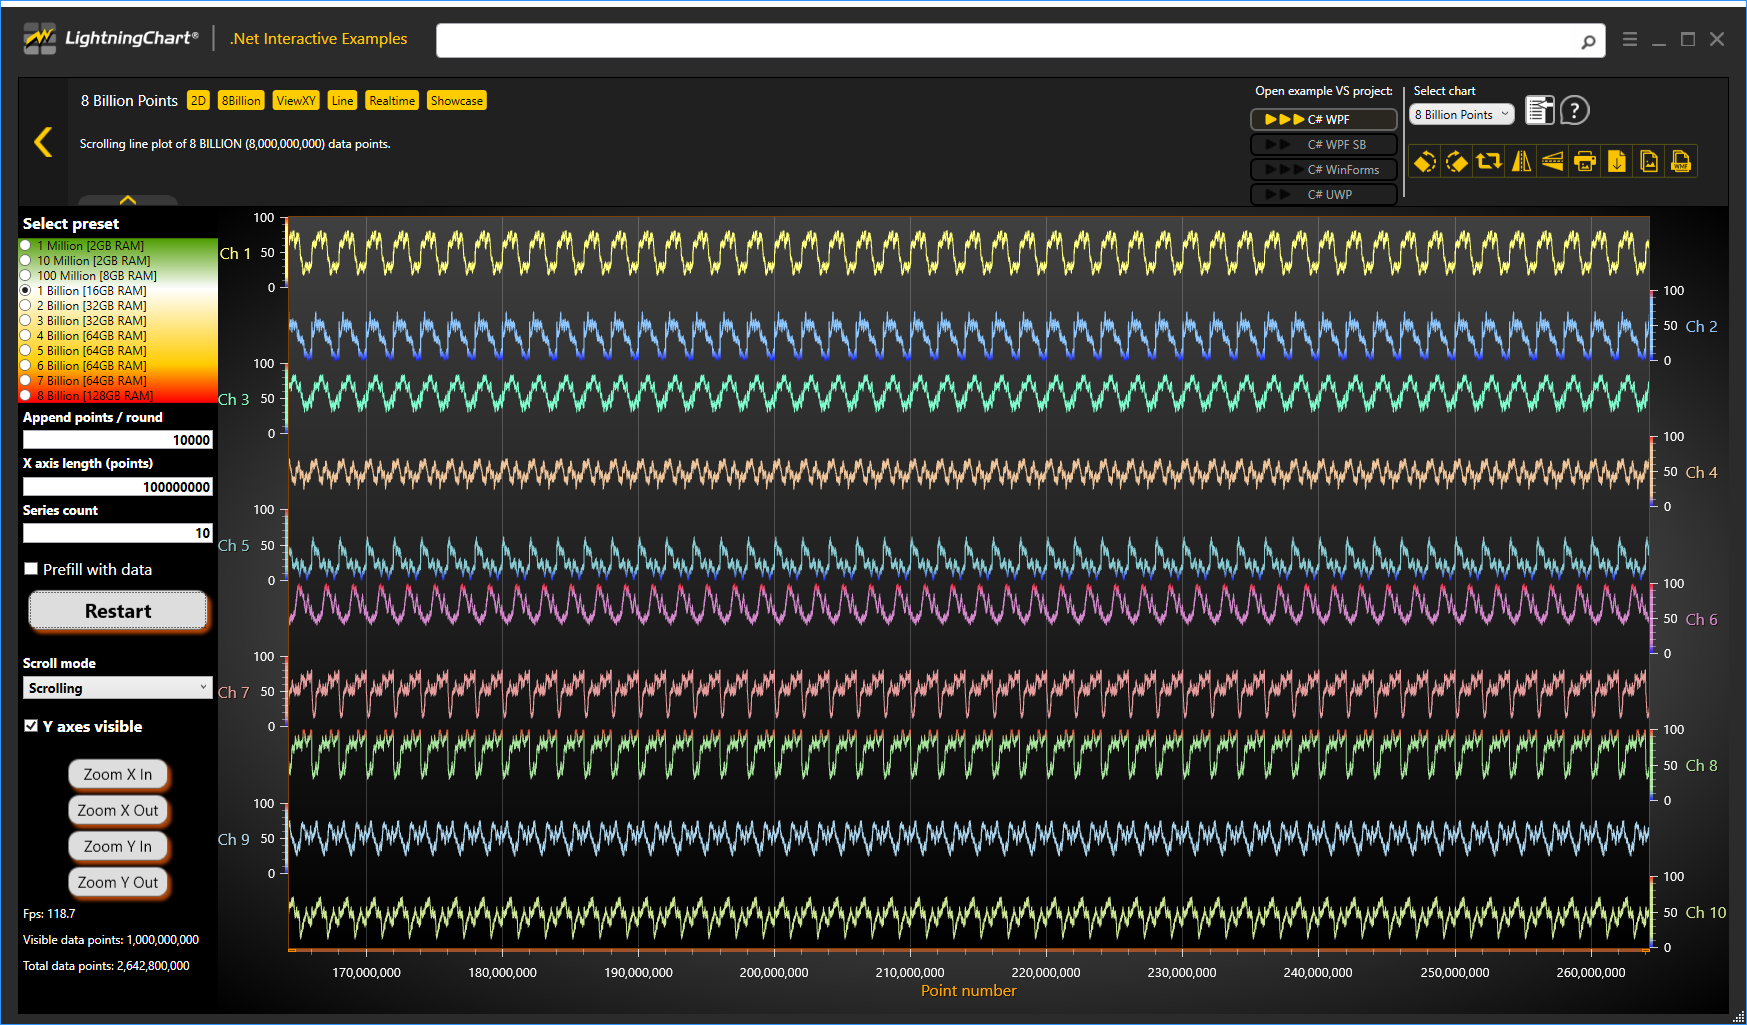
LightningChart .NET is the performance leader in WinForms charts. Visualization of millions of data points is effortless, real-time scroll and sweeping modes are built-in, and data is instantly load from huge data sets, and downsampling is not needed, the data is presented in full quality. The chart can visualize over 10 billion data points in extreme cases.

As LightningChart is a real WinForms control, you can add it in in WinForms designer, and set the properties with a property grid.

enter image description here

This chart has GPU acceleration with DirectX 11 and DirectX 9 engines, and lots of data processing is offloaded to GPU.

I've been involved with the development of the chart for over 10 years, the high performance requirements come from medical technologies and industrial automation.

0

Disclaimer: I work for Nevron.

Make sure to check out Nevron Chart for .NET. It is one of the oldest and most mature charting libraries out there:
https://www.nevron.com/products-dot-net-chart-overview

It comes with support for rendering of very large data sets, as well numerous options for data aggregation including 2d and 3d point cloud simplification, line simplification, surface/mesh simplification and stock chart grouping. All rendering is performed on the GPU.

Our next-generation data visualization control:
https://www.nevron.com/products-open-vision-nov-chart-control-overview will also soon have those features, but also add cross-platform support in the mix so you'll be able to write apps that run in WinForms, Wpf, and Blazor with the same code base.

Your Answer

By clicking “Post Your Answer”, you agree to our terms of service and acknowledge you have read our privacy policy.

Not the answer you're looking for? Browse other questions tagged or ask your own question.