2

Using a laptop's microphone, I want a graph showing the level of noise during a certain period:
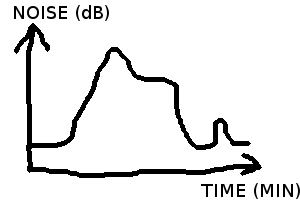
Noise graph

Noise needs to be sampled at a high rate and averaged over one minute or so. The output can be as simple as appending one line to a CSV file every minute.

Requirements:

  • Runs on Linux
  • Free, ideally open source
  • Calculate average for a minute, not instant value
  • Output to text file or image
  • Bonus if it can "filter out" usual background noise, in order to better show anormal noise (a "training" could be required to specify what the usual background noise is)

2 Answers 2

1

You could always use the python soundmeter library.

  • Runs on Linux
  • Libre & FOSS
  • You can average in a number of ways
  • You can either output to a text file or use one of the plotting libraries
  • Measures the RMS value.
4
  • On Ubuntu 2014.04, soundmeter requires portaudio19-dev which requires libjack-dev which requires libjack0. Installing libjack0 removes libjack-jackd2-0 and skype which is no go :-/
    – Nicolas Raoul
    Commented Dec 1, 2014 at 14:36
  • Have you considered a) Raising a ticket or b) porting to work with libjackd2-0 - tickets can be raised at github.com/shichao-an/soundmeter/issues and shichao-an seems to be approachable. Commented Dec 1, 2014 at 17:17
  • I guess this is an Ubuntu packaging problem with ` portaudio19-dev` or maybe just an incompatibility with Skype.
    – Nicolas Raoul
    Commented Dec 2, 2014 at 4:11
  • I have seen quite a lot of online comments regarding issues with both skype and libjack-jackd2-0 but I would still recommend raising a ticket to record the issue if nothing else. Commented Dec 2, 2014 at 7:32
0

I wrote this small bash script to do it:

#!/bin/bash
>data.txt
while true
do
  sox -t .wav "|arecord -d 1" -n stat 2>&1 | grep "RMS     amplitude" \
  | tr -d ' ' | cut -d ':' -f 2 >> data.txt
done

I takes the RMS every second and writes it to a text file.

A graph can be generated using this Gnuplot script (put it in a with graph.gnuplot file and run gnuplot graph.gnuplot):

set yrange [0:0.1]
set grid
set term png
set output 'graph.png'
plot 'data.txt' with line lt -1 lw 1

Your Answer

By clicking “Post Your Answer”, you agree to our terms of service and acknowledge you have read our privacy policy.

Not the answer you're looking for? Browse other questions tagged or ask your own question.