2

To help me understand large software projects, I'm looking for a program that reads Callgrind data (or another common and easily generated call-graph format) of software written in C, specifically so it can show me if and how one function is ultimately called by another, i.e. which functions lie "in between".

Basically like a call graph, except I give it two function names at the beginning and it should just show me if one of them appears in the other's call stack, as well as all the functions in between the two.

This is for software projects that are so large that simply exporting the entire call graph as a picture is unrealistic.

I know there is KCacheGrind for interactive visualization of Callgrind data, but it seems to have built-in limitations on what it is willing to show in a single graph, again in order to limit its size. For my purpose, however, the program wouldn't have to show any branching, just the "straight line" from one function to another (if it exists), so these kinds of limitations wouldn't be needed.

3
  • Do you need to handle tricky cases such as passing functions pointers, dynamic loading, etc?
    – Nicolas Raoul
    Commented Feb 6, 2016 at 5:45
  • @NicolasRaoul, as far as I know this is all taken care of by Callgrind, as it looks at what happens when a program is actually run (so at least function pointers shouldn't be an issue). I'm mostly just looking for software that can process Callgrind's output in the way I described. I'll write it myself if there's no such software yet (shouldn't be hard), but figured I'd ask here before reinventing the wheel.
    – smheidrich
    Commented Feb 6, 2016 at 5:55
  • I came across a way to do a very similar thing from an interactive debugger like gdb, which is explained here.
    – smheidrich
    Commented Feb 6, 2016 at 15:00

2 Answers 2

2

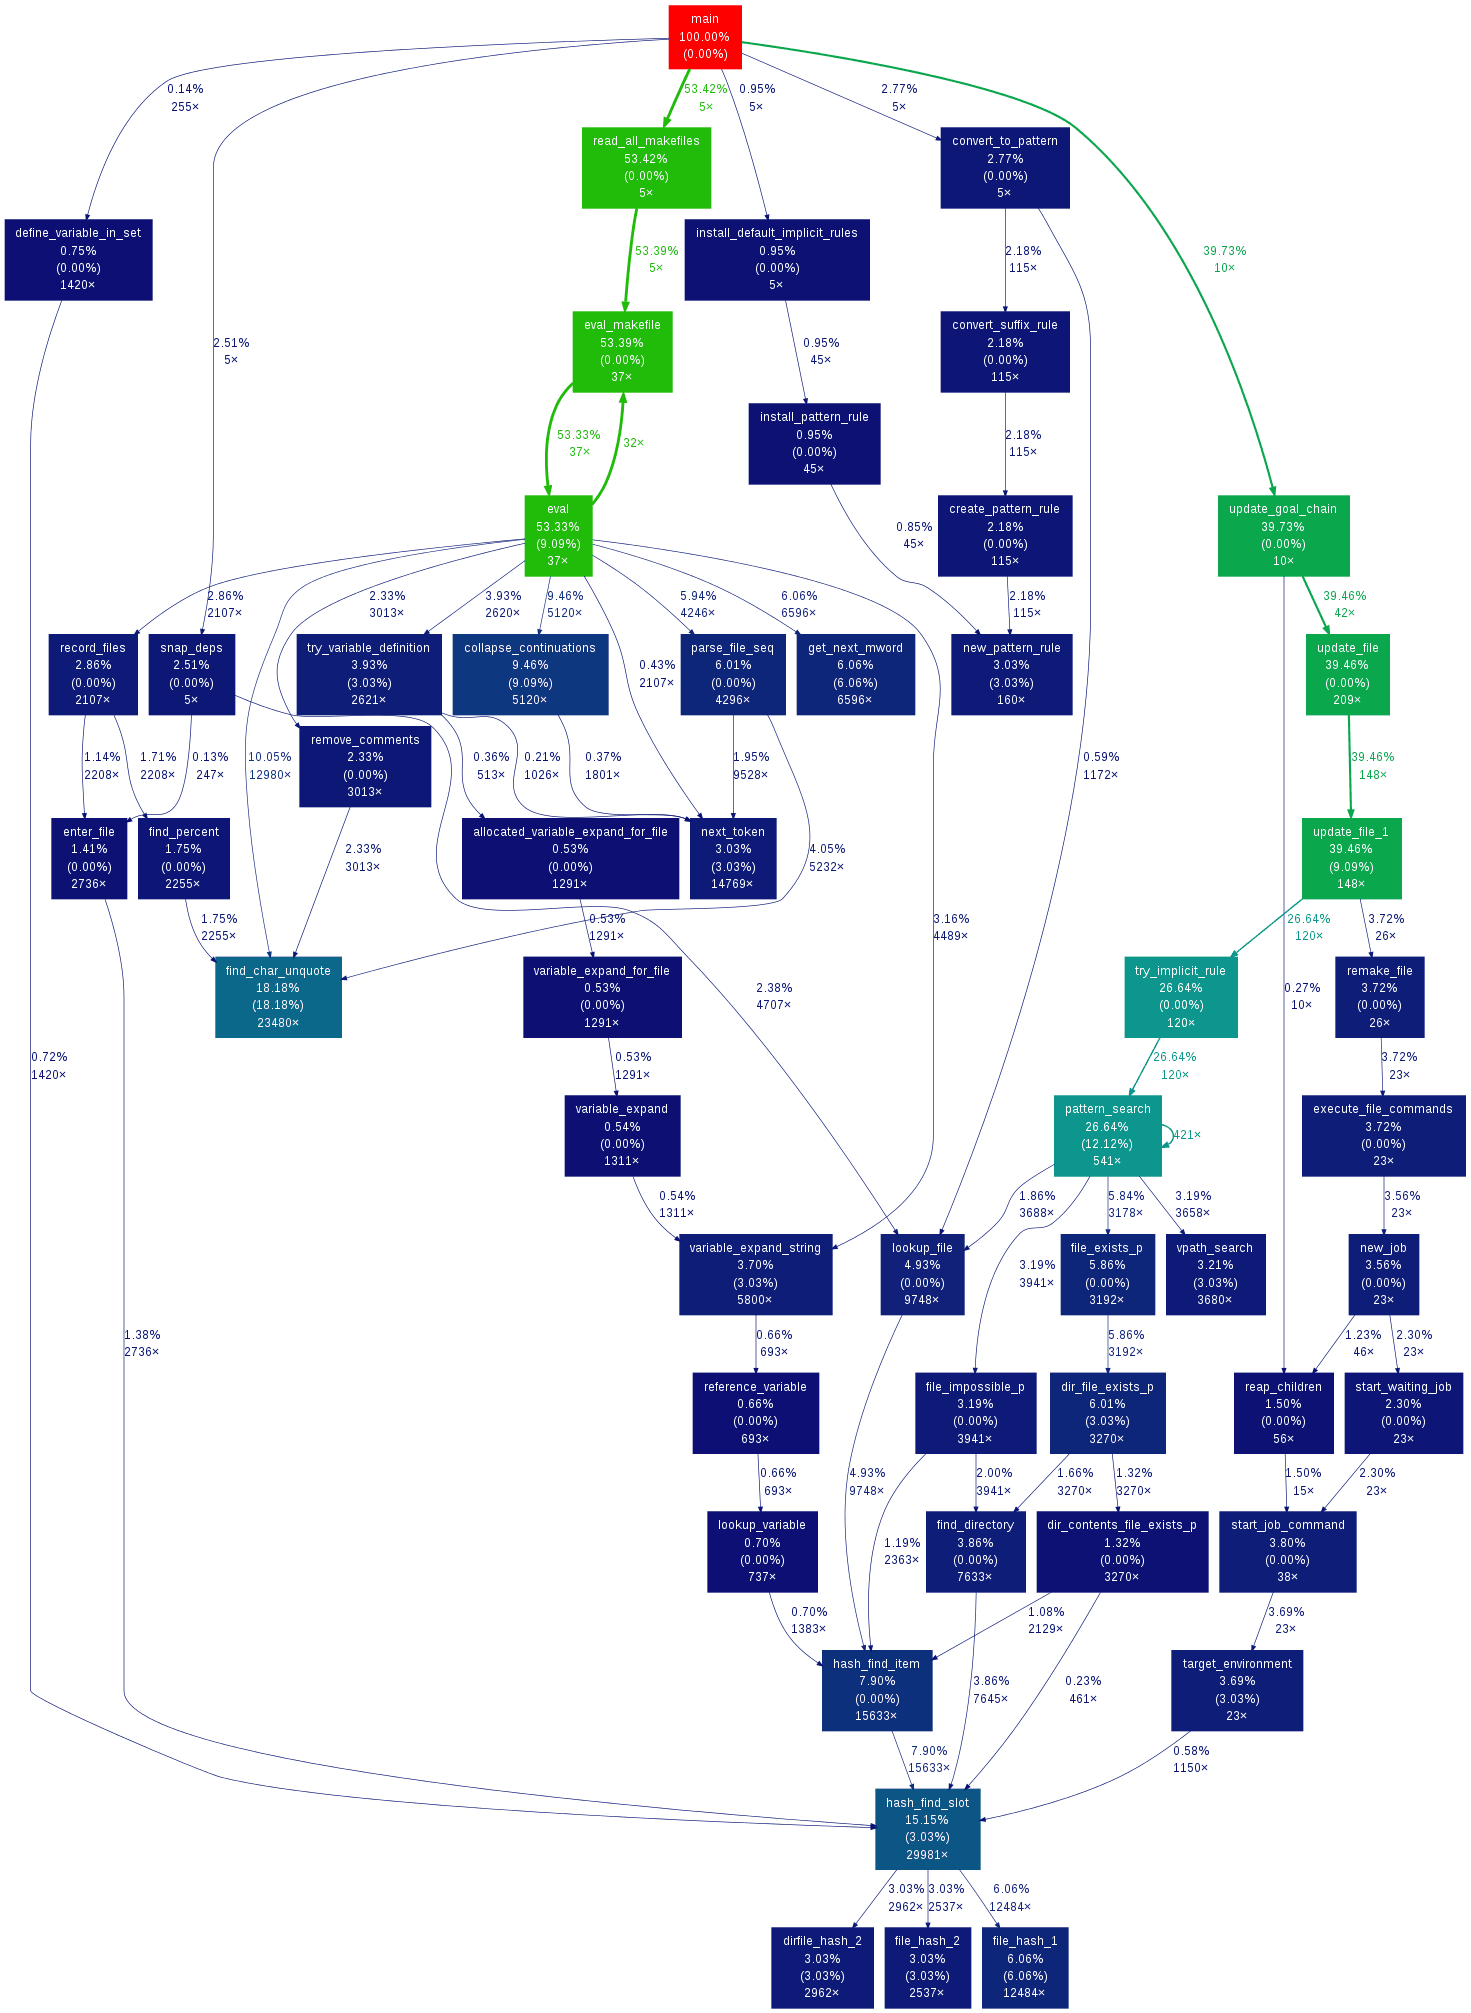
There is gprof2dot is a python which can process such output, without the size limitations, to produce a dot file that can then be converted to a graph using graphviz it can process the output of:

  • Linux perf
  • Valgrind's callgrind tool
  • oprofile
  • sysprof
  • xperf
  • VTune Amplifier XE
  • Very Sleepy
  • python profilers
  • Java's HPROF
  • prof, gprof

Example Output

enter image description here

Since it is going to be using python anyway you could probably use a little python to filter the graph to that between the functions that you are interested in or there are programs such as xdot.py, or its branches, and zgrviewer that allow zoomable display of the output.

You could also take a look at using doxygen's call and callers graphs - these will not handle any calls by function pointer, etc.

Optionally you could just put a stack dump/stack trace into the code at the beginning of function that you wish to produce the diagram for, this SO question discusses some options for doing that. Alternatively you could put a break point in under your debugger and then do a stack dump manually to get the information.

1
  • This is almost perfect, especially because gprof2dot already comes with the command-line options --leaf and --root, which allow you to set endpoints for the graph exactly in the way I described. The only problem with those is that in order for them to work properly I also have to set the node and edge thresholds to zero, which blows up the resulting DOT file (400kB even after I filtered unnecessary stuff), finally producing a 27MB PNG image that is too confusing and useless.So I think I'll do a small fork of gprof2dot like you suggested, thanks!
    – smheidrich
    Commented Feb 6, 2016 at 14:11
1

Why Callgrind doesn't work well

I ended up not using Callgrind for this after all, as it produced too many nodes that had nothing to do with the functions I was interested in and only appeared because they were called from cycles that contained intermediate functions.

For instance, let's say I'm interested in the relationship between A and C, but have call stacks such as:

A > B > C
X > B > Z > B

Then X and Z will appear in the graph produced with Callgrind even if a program such as gprof2dot is used which allows you to specify start and end points. Neither X nor Z are end points here, they're in a cycle, so they're not filtered out. I think the effort to remove this sort of garbage information from the graph far outweighs the effort I put into the solution I ended up using (see below).

My solution

So as per the suggestion at the end of Steve Barnes's answer, I used a debugger (gdb) to output stack traces and then processed them further. I wrote a small script to automate this, which can be found here.

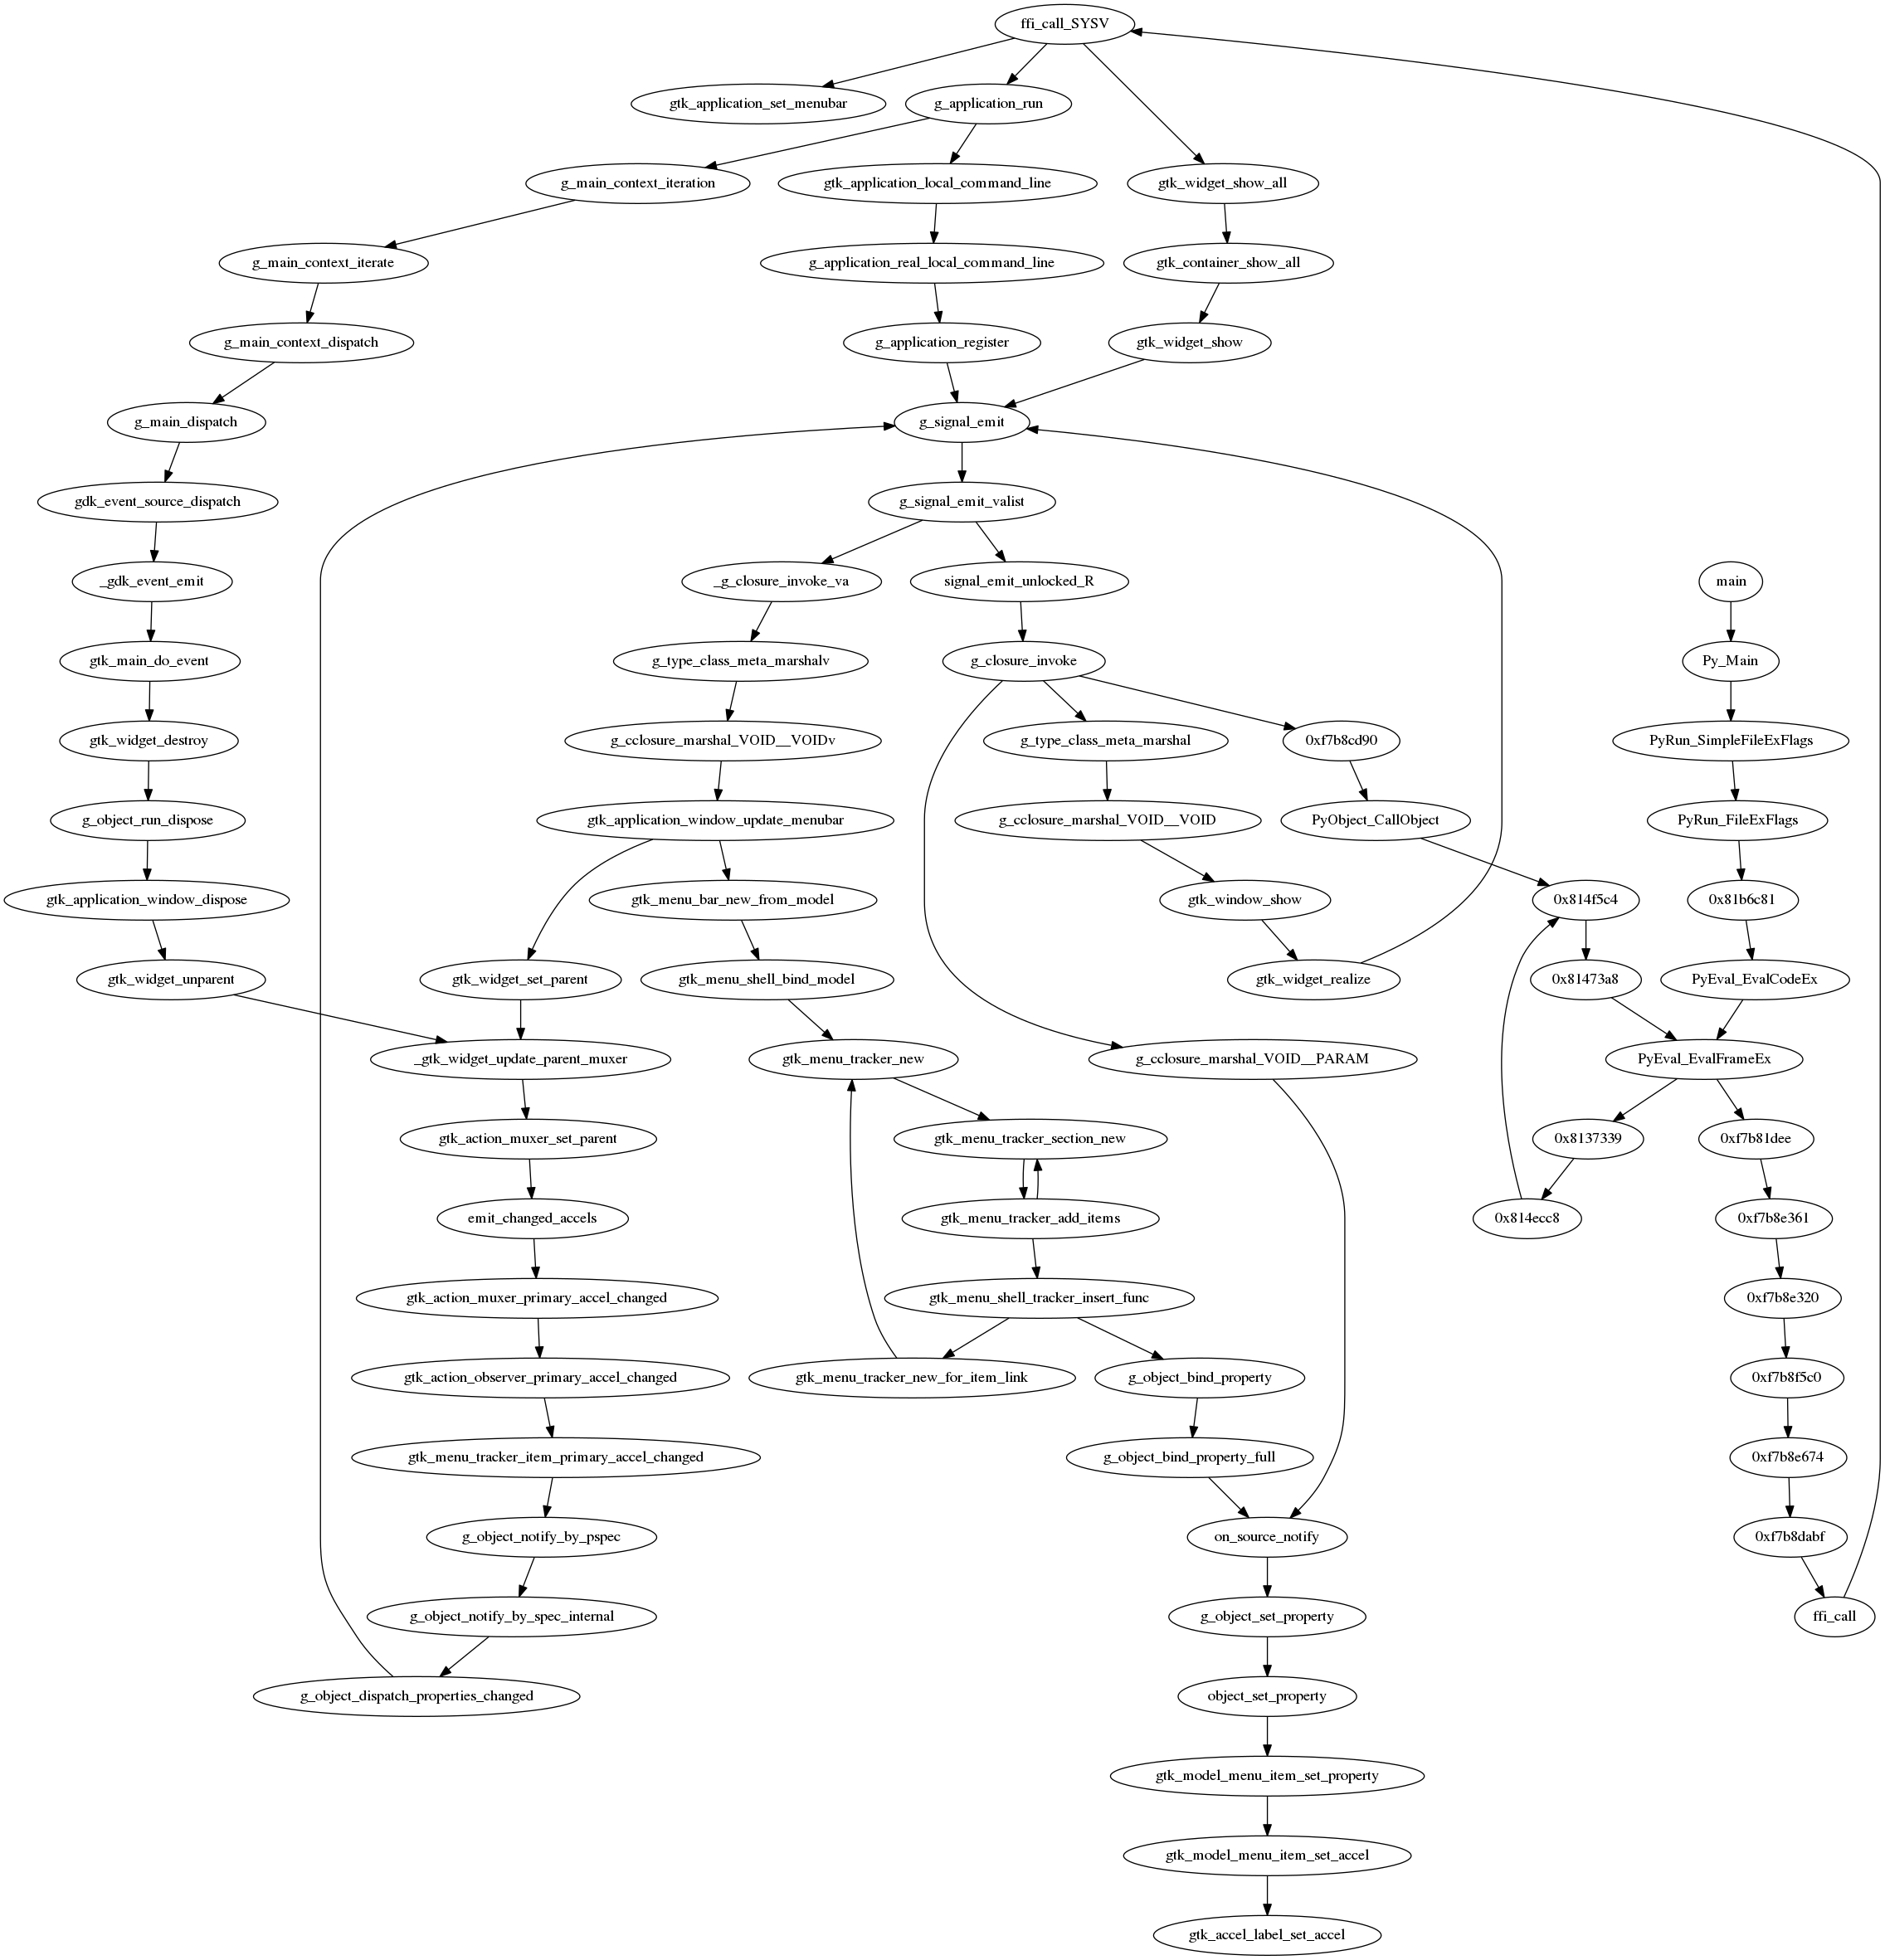
The graphs thus produced are a lot smaller than the ones I got from Callgrind data. Here is one for determining the relationship between two GTK+ functions gtk_application_set_menubar and gtk_accel_label_set_accel: graph showing the relationship between two GTK+ functions gtk_application_set_menubar and gtk_accel_label_set_accel

In this case it turned out that there is no direct call relationship; they only share common callers (the terminal output from my script was more useful in determining this than the graph itself, though).

Your Answer

By clicking “Post Your Answer”, you agree to our terms of service and acknowledge you have read our privacy policy.

Not the answer you're looking for? Browse other questions tagged or ask your own question.