I'm looking for some recommendations in terms of data visualisation tools.
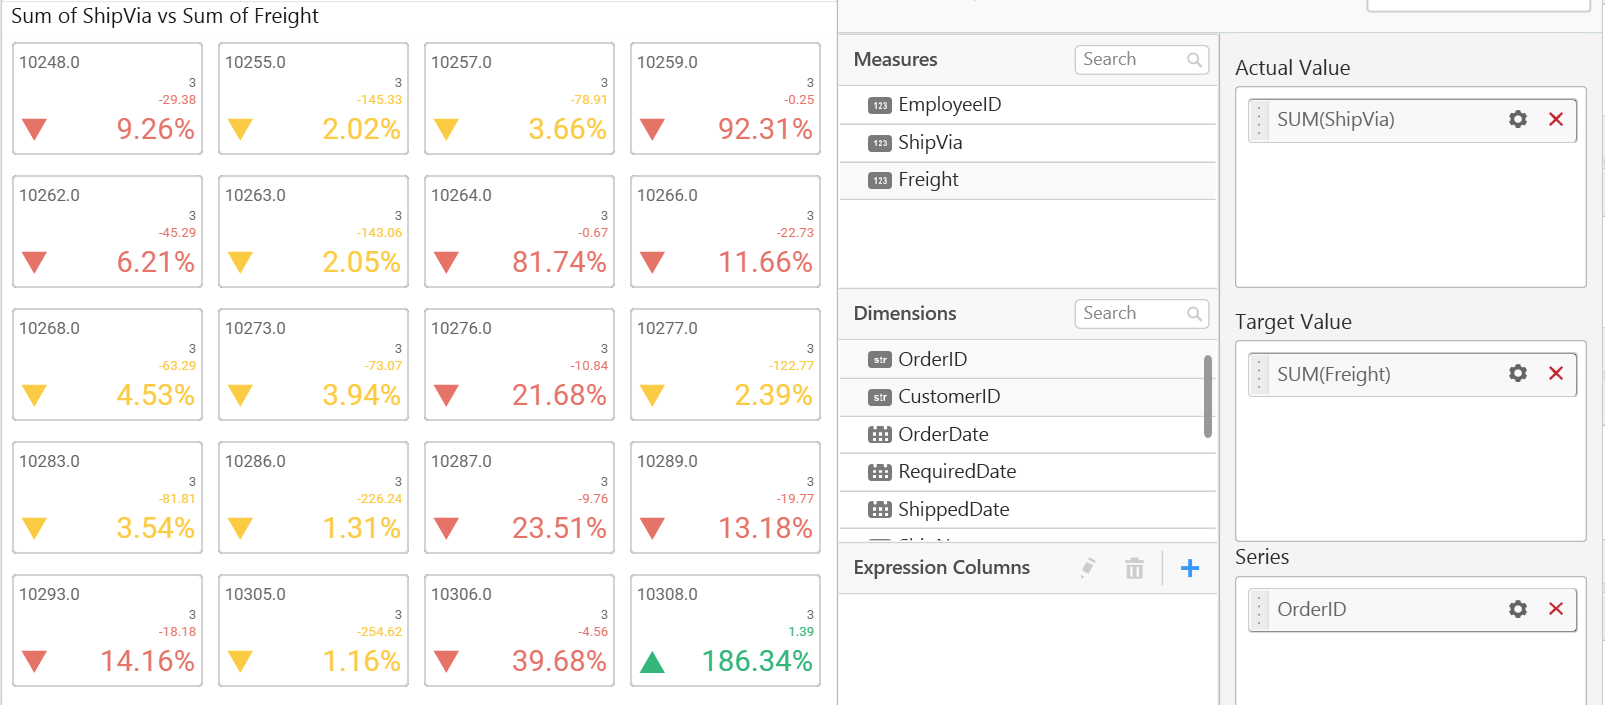
At my current place of work we have 'Wallboards' - these are basically web pages which are displayed on the big screens, similar to a call centre, but which show some key metrics for the business area inside individual 'tiles', aka pre-sized boxes. As an example, in the warehouse the board may have tiles such as total orders, outstanding orders and date/time of oldest order. The data is provided via embedded queries from our MSSQL databases.
I'm looking at options for replacing them based on the following key reasons:
They look bad - the layout/presentation is basic and not very appealing
They are a resource drain - changes to the wallboard require a webapp/programming developer to make the front-end changes, and an SQL Developer to write the back-end data retrieval
They aren't dynamic - any amends need to be manually added in, which in a fairly fast-paced business can be a problem
Any recommendations people can make regarding a good solution for displaying this sort of thing would be much appreciated. Even just something which removes the need for the front-end changes would be a step in the right direction. We currently have SQL Server 2008R2 up to 2014, but any new features in 2016 would be considered, as would external tools such as PowerBI, Tableau, QlikView etc.
To take a good example, each of our delivery routes has a tile. If we add a new route we need to manually add a new tile for it. I would love something which could take the source data (i.e. a T-SQL query or SProc which is grouped by route number) and display the stats for each route in their own tile automatically. I have toyed with calling a subreport in SSRS for each row in a dataset, but it's very difficult to control the layout the way I would want. Something responsive which knew my canvas was X inches by Y inches (to fit to the panel display) and set out the tiles automatically would be great.
Thanks in advance!


