36

I can't take anymore Matplotlib's general approach of "plotting-by-side-effect".

Is there an alternative?

I'm looking for something closer in philosophy to Mathematica's Plot function, which returns a stand-alone Graphics object. This object encapsulates all the information needed to render the corresponding image. There's no notion of "the current figure" or "the current axes".

(I'm looking for something that I can use comfortably from python code.)

4
  • 2
    Welcome to Software Recommendations! What exact features do you need? Please check with How to ask for an alternative to some software for possible improvements of your question, increasing the chances for good and matching answers :)
    – Izzy
    Commented Dec 16, 2015 at 0:09
  • 1
    @Izzy: to put it bluntly, I want to be able to plot from Python anything I can plot from Mathematica. I know this won't happen in my lifetime, so I'm looking for the closest approximation to this utopian ideal. ("Why not just use Mathematica?" Because I work in a group where most people know only Python, at best.)
    – kjo
    Commented Dec 16, 2015 at 2:34
  • 1
    Thanks for the update, kjo – but that should be part of the question itself. Remember, you can always edit your posts :) (I'm not familiar with Mathematica – but if "anything I can plot from Mathematica" is not self-explaining, you might need to elaborate on that as well)
    – Izzy
    Commented Dec 16, 2015 at 6:07
  • 3
    Note that while plotting by side effect is the primarily advertised way of using Matplotlib, it is not obligatory. For an introduction to object-oriented plotting, see this.
    – Wrzlprmft
    Commented Jan 21, 2020 at 18:45

3 Answers 3

16

There are a few alternatives that you might wish to look at:

  • plot.ly this does some very nice things and may be more of the style you would like, it can now be used offline and does tricks like embedding the java into a web page so as to give scrollable, zooming, etc., graphs - for python, R & Matlab it is free, open source and self hosted for Excel not so.
  • bokeh - again nice graphs - can be used from R, Scala & Julia as well as python.
  • ggplot - To quote the authors "ggplot sacrafices highly customization in favor of generall doing "what you'd expect"."
  • [New] [Cartify]4 gives a much more restrictive number of charts but aims to make life a lot simpler, (and more Object Oriented).
  • The old favourite matplotlib - very powerful but not necessarily the easiest to use and many of the examples you will find are based on the pyplot MATLAB style concept of the current current figure/axis - however it also provides an OO interface some examples of which you can find here so simply use it that way instead.

There is a nice overview here of some of the less painful to use visualisation tools.

From the comments of others not tried by me

  • Altair - Altair is a declarative statistical visualization library for Python. (ostrokach)
  • plotnine plotnine is an implementation of a grammar of graphics in Python, it is based on ggplot2. (hatshepsut)
10
  • 11
    Landed on this because of bugs in the matplotlib library for Python. Plot.ly and ggplot both rely on matplotlib. Bokeh doesn't, so for anyone needing to get around bugs in matplotlib, its an alternative.
    – Twitch
    Commented Feb 16, 2016 at 16:42
  • 1
    Add Altair to the list.
    – ostrokach
    Commented Nov 2, 2016 at 22:01
  • 1
    Plotnine is the best ggplot implementation in python.
    – Hatshepsut
    Commented Jul 18, 2018 at 21:48
  • plot.ly would allow only one private plot, wouldn't it? Not sure if I want every plot to be public shared. Looking for other interactive plot alternatives. Commented Oct 18, 2018 at 14:32
  • @EduardoReis - If you use plot.ly offline then all of the plots are private, in fact they are not even online unless you manually post them somewhere. Commented Oct 19, 2018 at 18:55
7

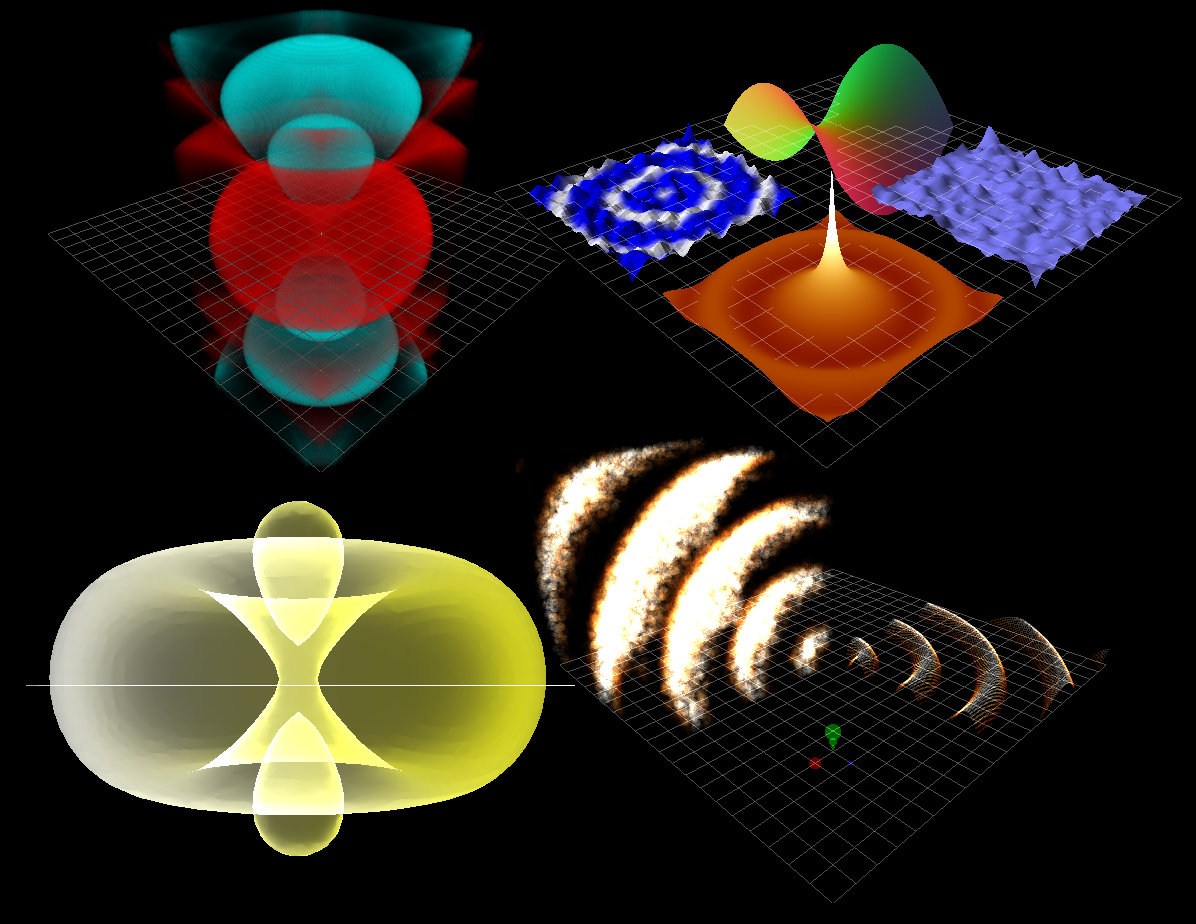
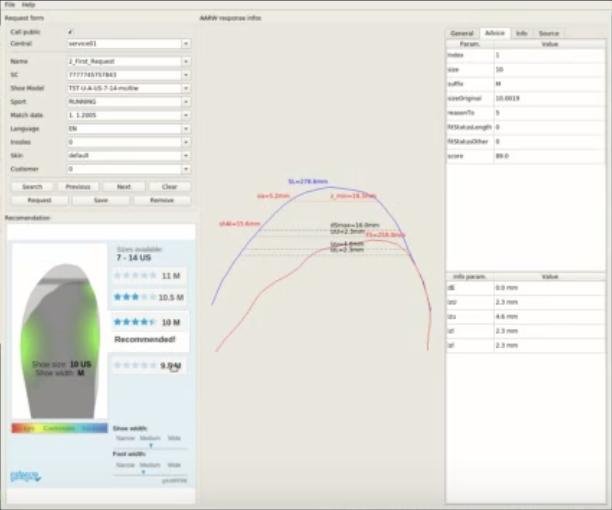
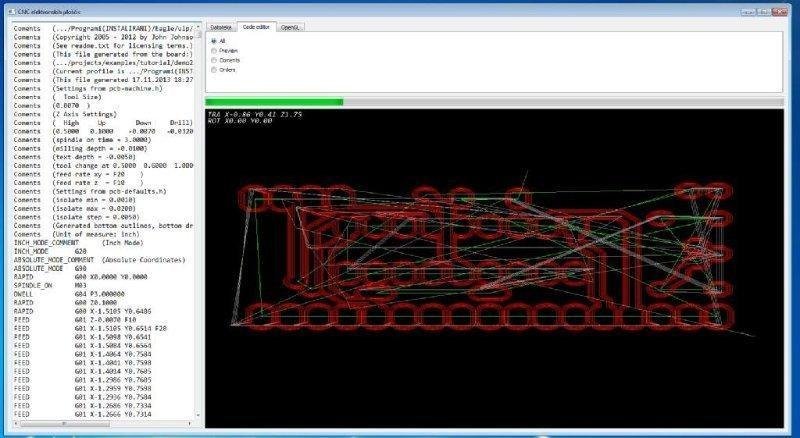
I'm developing advance PyQt applications and the main reason for not using Mathplotlib was that you can't create realtime complex graphs in 3D and 2D that updates at 60fps!

So I use: pyQtGraph Scientific Graphics and GUI Library for Python that uses OpenGL :)

PyQtGraph is a pure-python graphics and GUI library built on PyQt4 / PySide and numpy. It is intended for use in mathematics / scientific / engineering applications. Despite being written entirely in python, the library is very fast due to its heavy leverage of numpy for number crunching and Qt's GraphicsView framework for fast display. PyQtGraph is distributed under the MIT open-source license.

Some of example from web page and my own examples:

enter image description here enter image description here enter image description here

1
  • @user11879, is pyQtGraph current? documentation seems dated at circa 2011 and using PyQt4, not 5? Commented Sep 27, 2019 at 19:44
1

https://docs.enthought.com/mayavi/mayavi/ is also an option.

It is a Python wrapper around the much used and mature VTK.

The advantages are e.g. hardware acceleration for 1M+ points, nice shaders and full control of the scene (e.g. lighting).

1
  • Your answer could be improved with additional supporting information. Please edit to add further details, such as citations or documentation, so that others can confirm that your answer is correct. You can find more information on how to write good answers in the help center.
    – Community Bot
    Commented Jul 27, 2022 at 20:52

Your Answer

By clicking “Post Your Answer”, you agree to our terms of service and acknowledge you have read our privacy policy.

Not the answer you're looking for? Browse other questions tagged or ask your own question.