In the meantime I've chosen to implement my own tool using the Github API, Google Apps Script and Google Sheets.
Much of the code is repurposed from this tutorial by Ben Collins: https://www.benlcollins.com/apps-script/oauth-github/.
The following function does most of the work. The service variable and check can be left out if you're going to do less than 60 requests to the github API per hour. If you do want more requests you can refer to the tutorial posted above by Ben Collins on how to authenticate your Github requests with OAuth.
var repoName = "";
var userName = "";
var commitStartingRow = 5;
var commitStartingColumn = 1;
var sheet = SpreadsheetApp.getActiveSpreadsheet().getActiveSheet();
...

function getUserRepos() {
    const service = getGithubService_();
    if (service.hasAccess()) {
        Logger.log("App has access.");

        this.sheet.getRange("A5:E").clearContent();

        const githubApi = "https://api.github.com/";
        const headers = {
            "Authorization": "Bearer " + getGithubService_().getAccessToken(),
            "Accept": "application/vnd.github.v3+json",
            "muteHttpExceptions": true
        }

        const options = {
            "headers": headers,
            "method": "GET",
            "muteHttpExceptions": true
        }

        // Get comma separated github names to query with the github API
        var users = this.sheet.getRange(3, 2).getValue().split(',');

        users.forEach(function(elem, index) {

            this.userName = elem;

            var response = UrlFetchApp.fetch(githubApi + "users/" + elem + "/repos", options);
            // Parse the JSON reply
            var json = response.getContentText();
            var data = JSON.parse(json);

            data.forEach(function(elem, index) {

                if ([elem["language"]] == "Kotlin") {
                    var commitResponse = UrlFetchApp.fetch([elem["url"]] + "/commits")
                    var json = commitResponse.getContentText();
                    var commitData = JSON.parse(json);

                    this.repoName = [elem["name"]];

                    commitData.forEach(function(elem, index) {
                        this.commitStartingRow = this.commitStartingRow + 1;
                        sheet.getRange(this.commitStartingRow, commitStartingColumn, 1).setValue(this.userName);
                        sheet.getRange(this.commitStartingRow, commitStartingColumn + 1, 1).setValue(this.repoName);
                        sheet.getRange(this.commitStartingRow, commitStartingColumn + 2, 1).setValue(elem.commit.committer.name);
                        sheet.getRange(this.commitStartingRow, commitStartingColumn + 3, 1).setValue(elem.commit.message);
                        var commitDate = new Date(elem.commit.committer.date);
                        var formattedCommitDate = Utilities.formatDate(commitDate, "GMT", "yyyy-MM-dd HH:mm:ss")
                        sheet.getRange(this.commitStartingRow, commitStartingColumn + 3, 1).setValue(formattedCommitDate);

                    });
                }
            });

        });

    } else {
        Logger.log("App has no access yet.");

        // open this url to gain authorization from github
        var authorizationUrl = service.getAuthorizationUrl();
        Logger.log("Open the following URL and re-run the script: %s",
            authorizationUrl);
    }
}
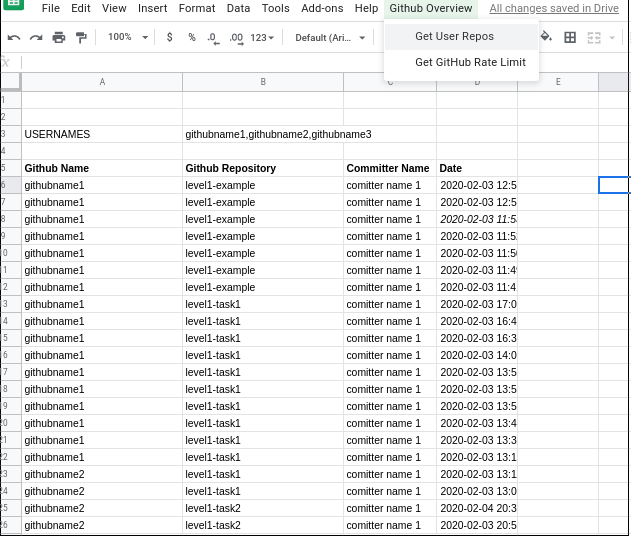
The result from running the function above looks something like this:

The custom menu to run the functions shown in the picture was created like this:
function onOpen() {
    var ui = SpreadsheetApp.getUi();
    ui.createMenu('Github Overview')
        .addItem('Get User Repos', 'getUserRepos')
        .addItem('Get GitHub Rate Limit', 'getGitHubRateLimit')
        .addToUi();
}
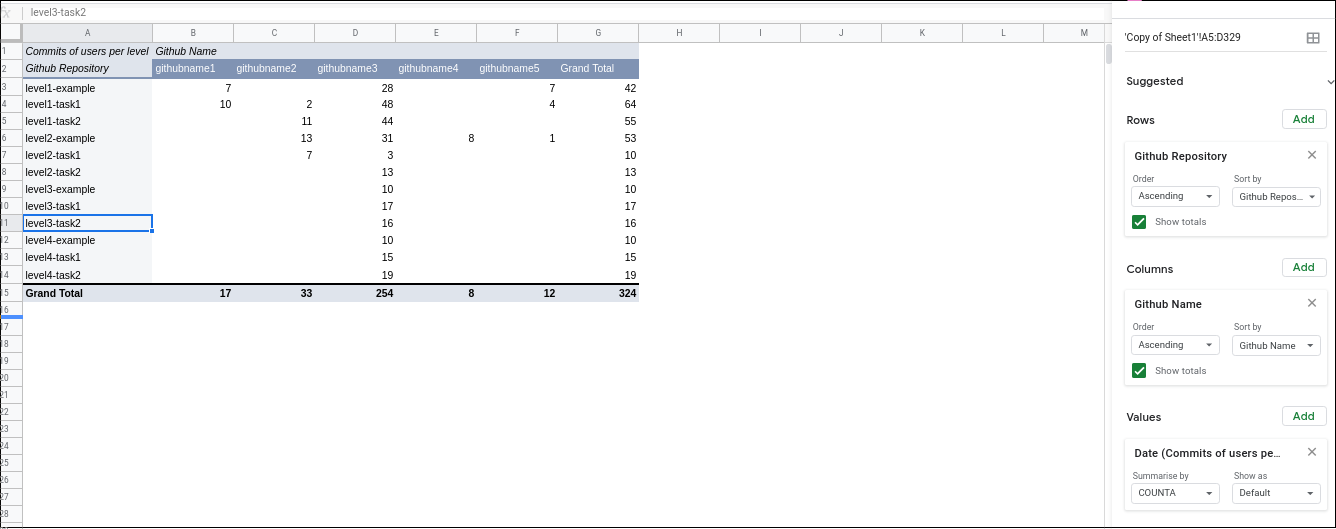
I used the output range of the raw Github data to generate a more insightful pivot table like this:

You will have to tweak and optimize this script to better suit your needs, but this at least shows a way to create an insightful overview for multiple separate repository statistics like number of commits per user per repository.
I have chosen not to use Events from Github API even though the code would be more efficient, because: "Events older than 90 days will not be included (even if the total number of events in the timeline is less than 300)". Source: https://developer.github.com/v3/activity/events/. In your particular use-case this might be the better choice though.


