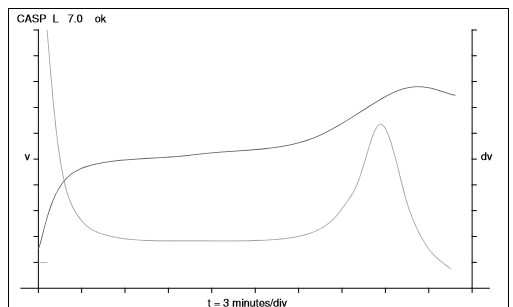
I've a old(er) battery analyzer, a CASP 2500. It has a DB25 connector on the back of it. I'm using a DB25-DB9 converter to connect it to the COM1/Serial Port of my computer.
I've modified some C# code to capture data from the serial port. According to the user manual for this battery analyzer, the recommended printer is the Epson FX Series 1.
The C# program does a good job of capturing the textual data, but when it comes to plotting (charge/discharge curves of a particular battery's life cycle) then it fails miserably and all I get is a bunch of "gibberish".
I've read about the ESC/P commands, but what I'm getting doesn't look even remotely like anything I've seen in the Epson user manual.
Basically, it needs to be able to print the plot to a file via the C# program, at which point it stores the file, including the graphical plots, to a network drive for long-term storage.
The company that manufactures the battery analyzer sells software to do just this, but for a seemingly exhorbitant amount of money, so if possible, would like to circumvent this by possibly developing my own program to convert this "gibberish" into the proper graphical output.
This is what the gibberish looks like when the program automatically saves it to a Microsoft Word .docx file:
CASP H 7.0b14 ok
Lw ????????? ?????????
Lw ? ?
Lw ? ?
Lw ? ?
Lw ????????? ?????????
Lw ? ?
Lw ? ?
Lw ? ?
Lw ????????? ?????????
Lw ? ?
Lw ? ?
etc. etc.
As you can see, the small amount of "gibberish" that I posted seems to correspond to the upper part of the plot.


