2

I am dealing with a set of graphs of moderate order (a few thousand nodes, a few hundred thousand edges) which however also have a temporal component.

This means that certain nodes and / or edges are active only during specific time intervals.

At the moment, I am handling this temporal nature "manually" by basically querying the graph at a specified time instance and rendering it via yEd when I have to.

BUT, when you are trying to depict the temporal evolution of the network, the nodes "jump around" because their position is not fixed throughout the visualisation.

I have tried to plot the full network (ignoring the temporal aspect), visualise that to fix the position of the nodes and then enable / disable each edge depending on the temporal dimension with some success. However, this is a hack and it takes quite a bit of effort marshaling all this information. I wonder if there is something already out there taking care of this (?)

Does anyone know of any similar (to yEd) piece of software for the visualisation of dynamic networks?

2 Answers 2

2

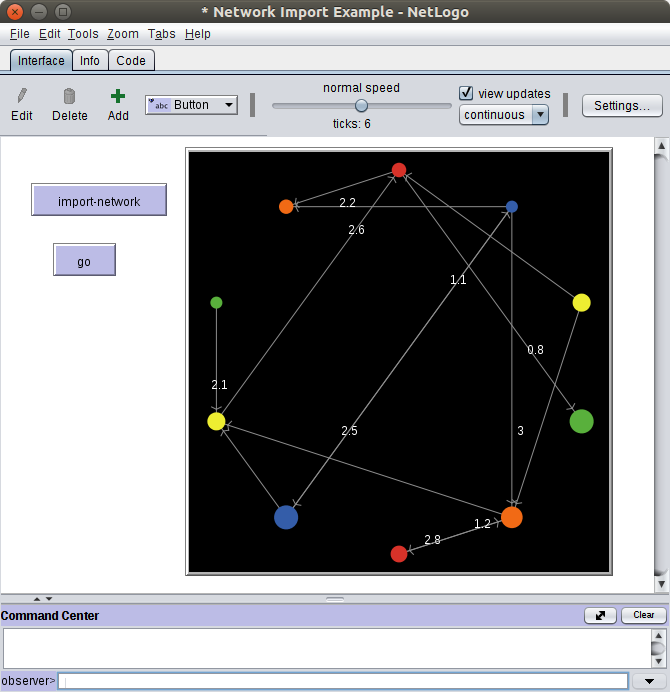
You could use the "Network Import Example" Model from Netlogo and customize it with code from the "Network Example" (which shows an animated graph with links flipping around). Both Models are present in the Models Library (= preinstalled).

Maybe its not your use-case and maybe it's too much effort to learn the new programming language. Maybe you need to specify the date-range with a datepicker, and that might be quite complicated in Netlogo.... Just saying: A working solution according to your requirements would probably esult in more work than expected.

enter image description here

"Network Import Example" takes in a Nodelist and an Edgelist both as .txt files. But I don't know how to import the link-creation / link deletion sequence The nodelist file, for instance, looks like this:

1    1.2    red
2    1.0    blue
3    1.5    yellow
4    2      green
5    1.8    orange
6    1.4    red
7    2      blue
8    1.5    yellow
9    1      green
10   1.2    orange

and the edgelist like this:

1  4  0.8
2  3  1.0
2  5  3
2  7  2.5
2  8  1.3
2  10 2.2
3  9  2.3
5  6  2.8
6  5  1.2
6  9  0.3
7  2  1.1
8  1  2.6
9  8  2.1
10 7  0.2
1
  • Thank you for your answer. I have used NetLogo before but what I am dealing with is something like this (but more complex). Therefore, the graph layout algorithm is an essential feature of the piece of software I am looking for. The circular layout is not very useful in this particular case I am dealing with.
    – A_A
    Commented May 3, 2018 at 10:56
0

Maybe you should use python and the package networkx,

You can get full control of temporal aspect, and easily handle any kind of data.

Lot of example are available, and you can have a very efficient help from stackoverflow community.

1
  • Thank you, this is how I am handling it at the moment. Fixing the layout via graphviz and then plotting the edges. But it would definitely be a more presentable result via a piece of software that is specifically built for graph visualisation.
    – A_A
    Commented May 3, 2018 at 15:34

Your Answer

By clicking “Post Your Answer”, you agree to our terms of service and acknowledge you have read our privacy policy.

Not the answer you're looking for? Browse other questions tagged or ask your own question.