0

What kind of software or coding language is good to implement a user friendly and visually appealing web base, enterprise level dashboard or visualization for analytics ?

This dashboard / report is run from data that is stored in a database engine. Regardless of what kind of database engine; what do you recommend that works best for the programming language or software that you'll advise to set this "Web-base Enterprise level dashboard" ?

Free and open source would be ideal, and all the charts that excel has and UI drill down would be great. There are Microstrategy, power BI, Cognos, clickview, tableau, MS sharepoint, MS Reporting Service but which one is free and open sources and has UI drill down out of these ? Would python, vb.net, asp.net, be good, what do you suggest or advise ?

4
  • What do you mean by "web base"? Any link to an "official" explanation of the term?
    – Nicolas Raoul
    Commented Apr 3, 2017 at 8:32
  • For the rest, any Business Intelligence suite fits your description, so please refine your question. For instance do you want it to be free / open source? What kind of charts do you want? Do you need a drill-down UI? Does it need to be usable on mobile screens? etc
    – Nicolas Raoul
    Commented Apr 3, 2017 at 8:35
  • @Nicolas Raoul - web base, I meant there is a link (URL) that users can go onto and see the visualization / dashboard / reports. Free / Open source is good if it's quality is also good or something cheap but good quality (I think office 365 is cheap - not sure). Bar charts, line graphs, column charts pretty much what you can do in excel charts (variety of them). Yes drill down is good, on desktop and mobile screen too.
    – Johnseito
    Commented Apr 3, 2017 at 14:51
  • Please add all of this information to the body of your question, thanks! Comments get deleted.
    – Nicolas Raoul
    Commented May 16, 2017 at 6:14

2 Answers 2

0

Bold BI provides an Enterprise Dashboard solution that can be used for Enterprise Dashboards and Analytics.

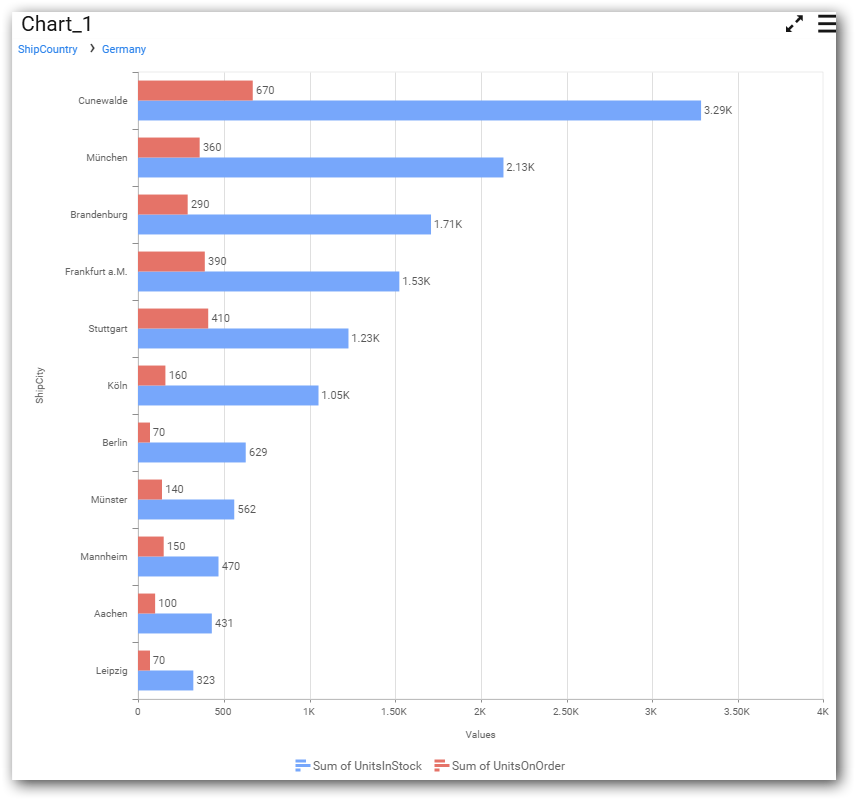
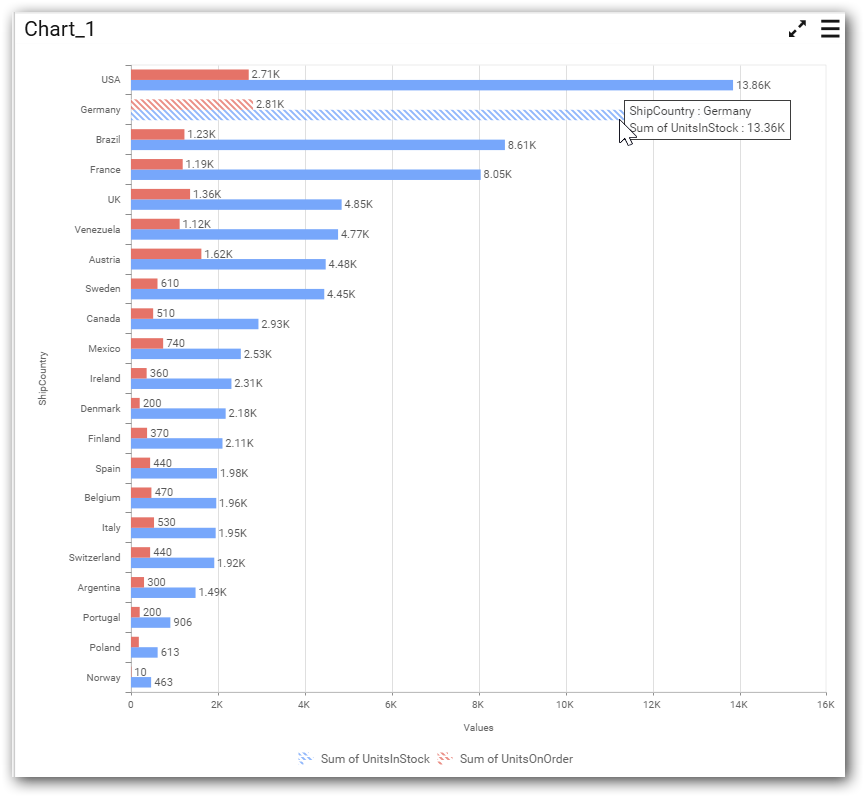
The charts included in the Dashboard platform support drill down.

Chart before drill down

Chart before drill down

Drilled down Chart

Chart after drill down

You can also embed the Dashboards into Enterprise applications.

Note: I work for Syncfusion.

0

Grafana is something we have used heavily for data visualisation. It does have compatibility with wide range of existing data stores and also has Json plugins to create own services to expose data

Your Answer

By clicking “Post Your Answer”, you agree to our terms of service and acknowledge you have read our privacy policy.

Not the answer you're looking for? Browse other questions tagged or ask your own question.