18

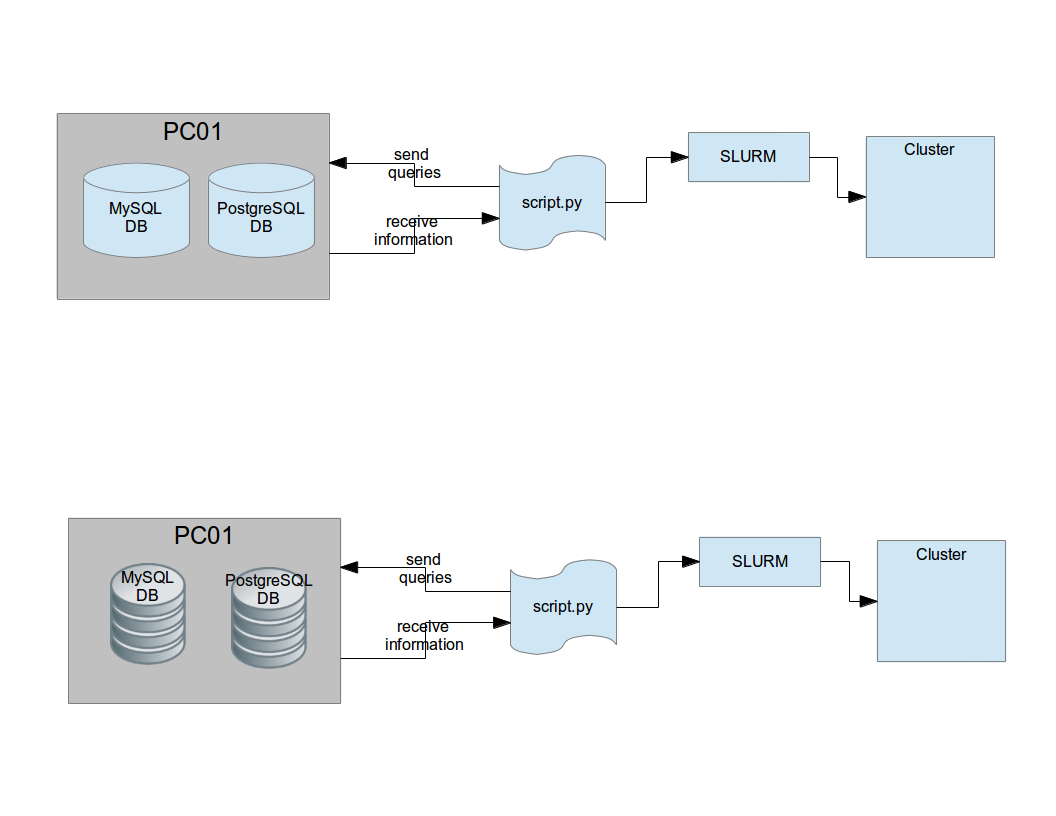
I would like to draw the data flow for the documentation of a project. I thought of something like this (created with Dia).

enter image description here

  • Functions: I would like to be able to draw databases, single computers, clusters and scripts / programs. I'm not content with dia, because:
    • It's difficult to get straight arrows (look at the one over "receive information". I currently "solve" this problem by zooming in quite a lot.)
    • There are no images (e.g. something like this for PCs or that for databases)
    • The image import/export is inconvenient. I can't export to a non-standard PDF size and I can't import svg (svgs get rastered when I import).

Please note that the most important feature is that it should allow me to create nice images that have information like the image above.

  • Price: It's ok for me to pay a maximum of 70 Euro for good programs. But there has to be a free test version that has all the required functions.
  • OS: Linux Mint 16 Petra (based on Ubuntu) - Web apps are not acceptable, but if you know a very good Windows program that runs with wine, that's ok (although I would prefer something from the repositories)

What I have tried

  • Dia: See above
  • GIMP:
    • Does not allow to draw arrows (at least it's very hard to do so)
    • Only rastered image export
  • Inkscape: Does not allow to draw arrows.
  • Visio: Looks nice, but 739 Euro are too much.
17
  • 1
    If I can show how to do what you want in one of the ones you already tried, would that be fine or are you looking for others? Commented Apr 15, 2014 at 14:28
  • 1
    what about running powerpoint in wine? :) Actually it has many flow shapes directly for this purpose and if you move the entities, their connecting lines (connected to connectors at their edges) follow.
    – miroxlav
    Commented Apr 15, 2014 at 14:46
  • 1
    Technically you can draw arrows with Inkscape. First draw a line then change its end marker. Then copy-paste this arrow if you need several.
    – Nicolas Raoul
    Commented Apr 16, 2014 at 10:20
  • 2
    @AngeloNeuschitzer - perhaps you can still add an answer shortly addressing all the pain points of Dia moose compained about. It might be still beneficial for other users who will find this Q&A later. As you can see, no one (including myself:) gave solid answer so far.
    – miroxlav
    Commented Apr 17, 2014 at 10:45
  • 2
    @JanDoggen: That's not the spirit of this site... we aim to provide better recommendations than Google :-)
    – Nicolas Raoul
    Commented Apr 18, 2014 at 8:46

7 Answers 7

1

Been for many years an infrequent yEd user, I want to add draw.io to the list.

Here's the diagram from the question, created in a desktop version of draw.io and subsequently exported to a PNG (clickable):

enter image description here

By the magic of draw.io (on export, it allows to embed the original diagram in the file), you can open it in the online editor -- "File" => "Import from" => "URL" (paste a link to the image above), and continue editing yourself )

6

I'd recommend yEd https://www.yworks.com/en/products/yfiles/yed/ which is free and runs fine on Linux, Mac or Windows.

Also check out the answers to these similar questions:

Software to draw state diagrams and asm charts?

Free/open source tool for creating flowcharts

https://graphicdesign.stackexchange.com/q/16629/17544

3
  • 3
    A definite thumbs up (+1) for yEdit. A nice feature is how easily you can import your own images, not just for a single diagram, but onto the palette, for use in future projects. I have built up a nice little collection of these over the years.
    – Mawg
    Commented May 6, 2015 at 7:05
  • Absolutely agree. ( See also cacoo -- they have an online editor that looks somewhat similar. ) But speaking from 2021, recently I discovered draw.io, and imho it's definitely worth a try. ( Probably shall even add it as another answer ) Commented Apr 21, 2021 at 6:57
  • Note, yEd is not free software but just Freeware. It requires Java Runtime Environment (JRE) and the website claims that it pulls additional software over the internet. Commented Jun 7, 2022 at 11:46
5

Try LibreOffice Draw or OpenOffice Draw (both free, both open-source, both multiplatform). They have basic flowchart shapes, connectors (lines with or without arrows that stick to the shapes and automatically route the lines) and using any image just require a copy paste or drag-drop. As an example for your chart, see this image:

example chart

I usually use the SNAI clipart images to do simple network diagrams

1
  • I've used OO too. Their PowerPoint clone can do pretty much what powerpoint can do in terms of diagramming. It isn't as mature as PP, and sometimes it is a struggle to get it to draw the picture you want. I'm not a MS fan, but in some cases MS PP wins by being considerably less difficult.
    – Ira Baxter
    Commented Aug 8, 2015 at 7:04
5

As much as I like some of the tools mentioned (I upvoted yEdit & highly recommend it), as programmer I sometimes eschew drag & drop, GUI based, tools in favour of those which take their input from a text file. That makes it easy for me to develop programs to generate the input text file from my own data.

You may not want to do that, but it is still worthwhile looking at GraphViz.

Here is a very simple example taken from the examples page of the site:

Input:

graph {  
           a -- b;   
           b -- c;   
           a -- c;   
           d -- c;   
           e -- c;   
           e -- a;   
      } 

Output: enter image description here

Obviously, it can produce much more complex diagrams that that, but that shows the principle - a simple text language to describe the relationship between nodes.

GraphViz has been around for a long time, is well supported, has an active forum and is widely used in academia and in some popular tools like DoxyGen.

Of particular interest to you the GitHub page How to create a network diagram with Graphviz (which uses images from Cisco) and IBM's Using Graphviz to generate automated system diagrams.


[Update] Since you haven't found an answer yet, take a look at Graphviz's "node types" and learn about custom shapes (this page includes, for instance, a database shape).

See also A database symbol for GraphViz, which adds enter image description here.

Using Graphviz to generate automated system diagrams might be interesting.

Something I had not thought of before (and plan to make lots of use of) is that you can generate Graphviz diagrams form a (MySql, etc) database using PHP (also JavaScript).

Perhaps that will help you.

3

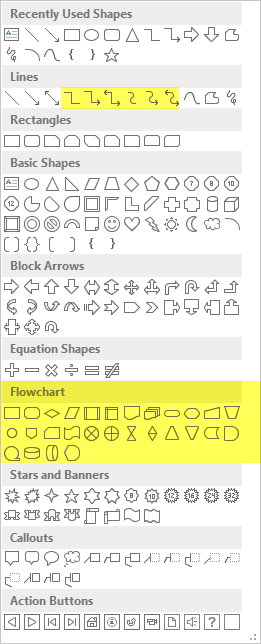
If a Wine is a way for you, maybe you can peek into Office apps:

Excel or PowerPoint

Excel and Powerpoint have basic support for creating flow diagrams.
I have highlighted relevant shapes, although other shapes work too:

PowerPoint Shapes

Use the connectors highlighted above in Lines section (I do not recommend standard lines – they flow in any angle, but highlighted lines combine horizontal-only and vertical-only sections). Connectors stick with edges of shapes so when you rearrange shapes, connectors follow.
Set of shapes is not limited, others can be found by searching in online libraries (directly from application).

Visio

Visio is The Tool for diagrams and flowcharts due to its wide possibilities.
If comparison of Visio editions shows you that Standard edition is sufficient for you (so you do not need diagrams updated dynamically based on currently available data), you can try meta search of e-shops in your country (sample for my country) to find better deals (€319) than price you see on Microsoft page (€399). (Be careful not to purchase AE or OLP versions where special licensing conditions apply.) The decision to buy or not to buy should be made on evaluation whether such a management and presentation of your charts/diagrams is worth the price and pays itself back.
Programmers will potentially appreciate programmatic access to documents (similar to other Office apps) so you can generate or read your flowcharts/diagrams using Visual Basic code.
There is a 60-day trial available. You can use it to test how it works with Wine and to try whether it is the right tool for you or not.

1
  • IF you dont want to spend money (well anymore than you already have, assuming you have Office installed). PowerPoint is perfectly effective on this one. It is not as powerful as Vision in the actual workflow area but if all you are looking for is creating designs to port to another document it has everything you need.
    – James
    Commented Apr 17, 2014 at 15:47
1

Your question seems like Mind Mapping tool is an ideal solution for you.

As far as the best mind mapping tool goes, I would recommend you to use XMind with Wine software for Linux.

This tool is really useful and I use it often to design workflows or mockups. It's also pretty Cheap. (You can use the free version as well).

Extensive list of core Features :

  • Mind Mapping
  • Fishbone Chart
  • Matrix
  • Local Network Sharing
  • Brainstorming
  • Mind Toolbox
  • Drill Down
  • Gantt View
  • Works with Office/PDF

Additional Features :

More Features

Presentation Effectively presents mind maps to audience with a minimum of distraction, focusing in on a particular topic.

Theme A way to set the properties of your map quickly and easily. Theme is the collection of colors, shapes, line patterns, and other coordinated graphical attributes of a map.

Map Merge The Merge maps can help you to organize the information from more than one map by merging two maps together.

Map Shot Mapshot lets you share either the whole or a part of a map with someone else. It’s different from screen shot. The area you can choose can from the full map.

Advanced Filter By filtering markers or labels from the large project, we will darken the rest of the map and then focus on the most important tasks.

Powerful Search You can find any content in all opening files. In this view, you can type the targeted content, modify search options, and check the search result.

Audio Notes Helps to capture spoken information during meetings, brainstorming sessions, or other activities. It enables you to annotate topics without typing.

Encrypt with Password Security is always at the first priority. XMind lets you set a password for your XMind file. Without password, no one can open the file.

SVG While export maps to image, you may find it blurred when we zoom in. But now we can check and print your maps at any scale by exporting to SVG.

Online Mind Map Library With a free XMind ID, you can publish your mind maps to the online mind map library on XMind.net. It's like an online community.

Templates In this busy world, we're constantly asked to do more in less time. Starting with a good template to meet the demands of life, work and study.

Clip Art One principle of mind mapping is: Picture Welcomed. To help express your thought visually, let's spice up your maps with pics.188 totally new clip arts in XMind 2013.


It also has pre-designed templates

enter image description here


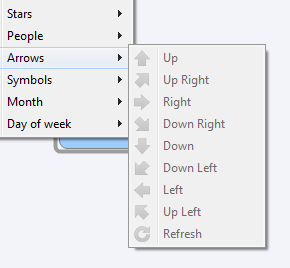
Shapes of arrows

enter image description here


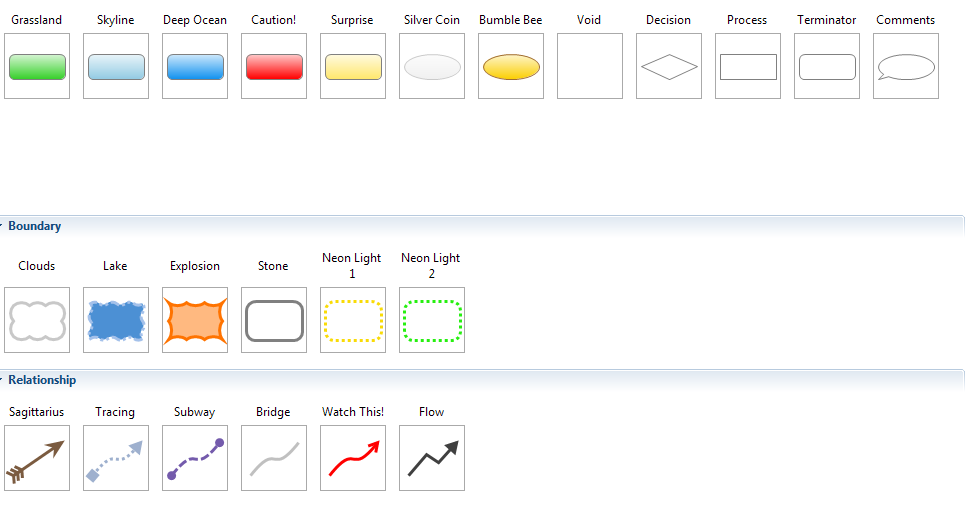
Other Shapes useful for Flow Chart

enter image description here

2
  • How does one create a data flow diagram with this? Could you create something alike the screenshot of the OP to show how it works? Commented Apr 21, 2014 at 9:44
  • While "mind mapping" software has somewhat similar goals -- it is usually about trees, so drawing any graph with cycles could be difficult Commented Apr 21, 2021 at 7:02
1

Looks like this hasn't been touched in a while. My thoughts are based one key observation - misunderstanding of what a DFD is, by the original poster and all of the responses. A flowchart is not a DFD.

Fundamentally, a DFD has only a very few symbols:

  • A data store (any type) drawn as two parallel horizontal lines with the description of the type of data between those lines (like this:

--

ATable

--

and there can be many such stores or intermediates, including materialized views. (I found a better example, PNG format. See later in this answer.)

  • A circle with embedded description to indicate a process (such as "Extract User Details")

  • Single direction arrows t0 show data going to (or from) the store(s) and or processes; if there are bidirectional flows, use two arrows

  • A box with embedded label or name to indicate systems (often, these are generic, such as "External systems" that provide data to or from the solution under consideration)

  • A notation/comment box (with a "torn corner" to look like a document), to describe what the data "is" or "looks like" or in some cases, to indicate operational aspects (such as to indicate nightly batch jobs). A notation box is attached to the corresponding DFD element with a dashed line. Keep them simple.

In some cases, larger boxes may be used to group several of the elements above, to indicate, for example, location or ownership or other aggregated detail. For example, "Vendor A cloud" might include one or more stores, processes/services, and a notation box with summarized details. These boxes may be drawn with dashed lines, and if so are referred to as "trust boundaries" - they usually represent systems over which you have no control, but which provide data to or from your solution.

And that's it. There are no decision diamonds, alternate flow paths, or any of the other dozen or more typical flowchart symbols. Alternate flow paths can be shown, if critical to the solution, as notated arrows (with notation box), such as "Path if primary router fails". If you want to walk the viewer through how data flows relative to programmatic flows, add a notation box and tell them to go look at a related flowchart - but don't put it in the DFD or it's not a DFD anymore.

I'm not aware of any specific tools for creating DFD's on Linux (or Windows). As reflected in the earlier replies, some folk resort to using (abusing?) flowchart symbols. DFD's are simpler, cleaner, and easily understood by even the most non-technical of folk yet provide insight to technical teams too. It would be possible to create a very simple DFD symbol set for Dia, which would probably be my first choice, and can be processed to retrieve connection details if needed. LibreOffice Impress / PowerPoint symbols could be created too, but you begin to lose the efficiency of a diagramming tool and "wiring" details and will quickly be tempted to add symbols that don't belong on a DFD. Visio is a distant third, due to cost, the previously mentioned temptations to "over-draw", etc. but it does produce nice output.

Looking around a bit, I found this (https://github.com/michenriksen/dia-dfd/blob/master/example.png) example of a DFD and a Dia symbol "set" (actually, just the store indicator and a dashed box), but it relies on Dia for the arrows, notation box (from flowchart "Document"), and process (circle), also from the flowchart tools. As a result, to get them you have to use the flowchart set and rely on your own self-discipline. You still have the other shapes nearby, ready to abuse. Don't. A better solution would be to create a specific DFD shape set, with the store indicator, a process circle, a system(s) box, a boundary/trust box, a notation box, and arrows.

Your Answer

By clicking “Post Your Answer”, you agree to our terms of service and acknowledge you have read our privacy policy.

Not the answer you're looking for? Browse other questions tagged or ask your own question.